
Q.
Table 1 below shows the demand and supply for single storey terrace houses in Semenyih, Selangor.
(a) Based on the information above, determine the market condition for each of the price category. Support your answer with calculations. (15 marks)
(b) Based on your answer in Question 2(a), draw the market demand and supply curve. Determine the equilibrium point, surplus and shortage area. (8 marks)
(c) What is the equilibrium price and quantity? (2 marks)
(25 marks, 2016 Q2)
A.
Analysis of the prices can be seen from the graphs below:
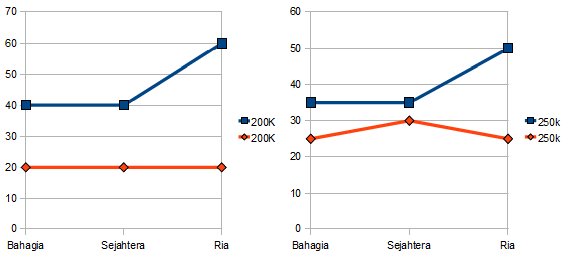

The Y-Axis represent units of demand, the X-Axis represents the 3 Tamans - Bahagia, Sejahtera and Ria. Demand is in Blue, and Supply is in Red.
a)
The question asks 'market condition for each of the price category'. There are 6 price categories as in 6 graphs. Separately, they are listed below.
Bear in mind that the demand and supply represent the unit of product demanded or supplied. This is relative to each other.
Category 200K - Supply (Red) for this price category is flat. It seems the market is not interested in this category of housing. The supply is not meeting the demand especially in Taman Ria, where the demand is 60 units and supply is only 20 units. Such situation may indicate that it is not profitable to build this category of price, where the people demand more. The general pattern across the 3 tamans shows that demand outstrips the supply.
Category 250K - This category seems to be better than the 200K category showing that the demand (blue) is nearer to the suppy (red). Only in Taman Ria again that the demand outstrips the supply by a larger difference (25 supplied but 50 demanded). This is the same as in category 200K (60-20 = 40), although the gap is smaller (50-25 = 25). From this, it can be said that Taman Ria is of lower income region, where a lot of demand is for lower price category, but the supply is unable to meet the demand.
Category 300K - This price category sees the pattern of demand (blue) crossing the supply curve (red). This means demand and supply generally are able to meet up with each other - which signify an equiribrium. Taman Bahagia has the equilibrium of demand and supply. It shows the unit demanded is supplied in full. In cases of Sejahtera and Ria, demand or supply only unmatched for 10 units. This phenomenon shows that the price category of 300K sees a good match with the type of single storey houses. May be the general market household affordability of the income is at this price range.
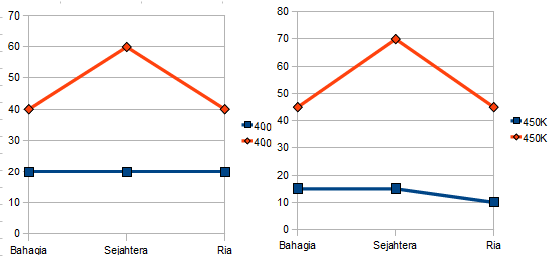
Category 350K - Taman Sejahtera has much higher supply than demand (50-25 = 25) than both Taman Bahagia and Ria at this price category. All the tamans has shown higher supply than demand at this price range. It seems that market is starting to show ffordability issue at this range. It means most people demand lower price, but developer is supplying at higher price range (350K).
Category 400K - Demand (blue) is flat at 20, however supply (red) is beyond demand (40-60). Taman Sejahtera has highest supply (60), which outstripped demand by 40 units (60-20). This means every 6 units built, only 2 units are sold, with 4 units left unsold.
Category 450K - Demand (blue) is even lower (10 - 15) than 400K category (20). Supply is even worse, 45 - 70 units! Thus, for this category, surplus supply is causing the market to stagnate, as left over unsold units are abundance.
In conclusion, the equilibrium price with demand and supply is at RM300K. Housing projects of single storey terrace beyong 300K will start seeing surplus as people cannot afford. Below 300K sees demand overwhelming supply. Taman Sejahtera seems to be the region which is active in construction, with the highest unsold units. This could be the market outlook that this taman has future potential or the land cost is relatively lower than the others. Such scenario could fuel more supply as cost is lower. Taman Ria seems to be a lower income region, which higher demand at the category below 300K, where demand overwhelmed supply. It could be due to land scarcity that low cost houses can no more be constructed. This shortage in the market is the driver for higher demand.
b)
Market demand and supply curve, equilibrium point, surplus and shortage area
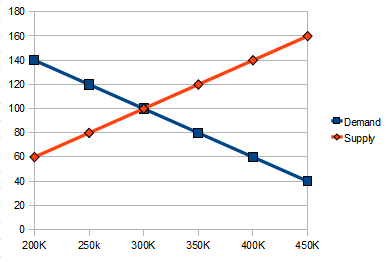
The aggregate demand - supply curve cuts through at RM300K. Below RM300K, there is a shortage of supply. Above RM300K there is surplus of supply.
c)
Equilibrium price and quantity
Based on b), the equilibrium price is RM300,000. Quantity is at 100 units.
Ref:
Own account.